Whether you are providing corporate training, commercial eLearning, non-profit education or anything else involving using an LMS to teach people something, reporting is one of the essential tools in your tool-belt. Of course, you first need your LMS to be capable in all the basics: creating courses, managing users, scheduling classes, presenting rich content, serving tests, handling transactions (in the case of commercial eLearning), and so on.
But those things go without saying, whereas Reporting is kind of an unsung hero: indispensable, yet out of the spotlight. In this post, we will bring it into the spotlight, by going through the reasons that make it so important, describing the ways you can leverage it, and explaining how Reporting works in TalentLMS.
Your training program’s effectiveness gauge
As a business, you don’t just want to have a training program. You want to have a **effective** training program.
That is, your training program is not just something you’ve implemented in order to tick some box — it’s part of your corporate strategy, intended to improve your workforce’s skills and (ultimately) provide some measurable ROI.
eLearning analytics, then, is the best way to measure its success in doing so, and, when all is said and done, they boil down to two general insights:
- how effective your training is, and
- how well your employees are performing.
Note that those are not only two different things to measure, but also sort of independent: you can have a well-designed training program that would have been very effective if it weren’t for lazy and unmotivated learners. And vice versa, you could have very motivated learners whose learning is inhibited by badly designed courses.
Now, unless things are really dire (e.g. everybody’s failing a course), there’s no single obvious metric that will tell you that your courses need some rethinking or that your employees are not trying hard enough.
Fret not, however, as an eLearning report makes it easy enough to reason about both of those things — by looking for general trends and spotting irregularities.

An increased number of learners scoring at or below average on a course, for example, can give you a strong hint that this particular course is too advanced or too confusing, and needs to be broken down further — especially if this has been observed over several terms.
Similarly, employees with decreased online attendance compared to the rest of their colleagues might either be too brilliant (and thus pick things up faster) or too lazy. Using reports to correlate their course results with their attendance can easily tell you which is the case.
Reporting is just not just a passive forensic tool either — both the examples we gave above provide actionable information that you can use to improve your training program.
In the second case, for example, you should have a talk with the lowest performing employees with the bad attendance record. Perhaps they are not lazy but stressed out on some work-related issue. Or maybe the course material is above their skill level, thus dispiriting them — and you need to add an easier, introductory course as a prerequisite.
In the first case, you could re-examine the course’s material and/or discuss the situation with its instructor. And then, of course, after you’ve made your adjustments, you should repeat the Reporting process and check your LMS metrics again to verify that it worked well. Rinse, repeat.
This is what LMS reporting features are about — not mere visual eye candy or something to put up for a presentation to the CEO, but a way to get actionable insight, and as a continuous gauge you can use to steer your eLearning towards increased effectiveness.
That said, Reports are also very handy for giving your CEO or upper management a quick overview of your training program — or a periodic status update that’s automatically delivered to their email box.
All of the above, and quite a few things more than we’ll cover in the next section are available through TalentLMS’ Reporting tools.
Let’s go for a quick tour of the available options.
Reporting in TalentLMS
TalentLMS’ reporting tools can be found in the aptly titled “Reports” page.

Looking for an eLearning platform to measure employee success?
Compile custom reports in no time with TalentLMS.
The training platform that users consistently rank #1.
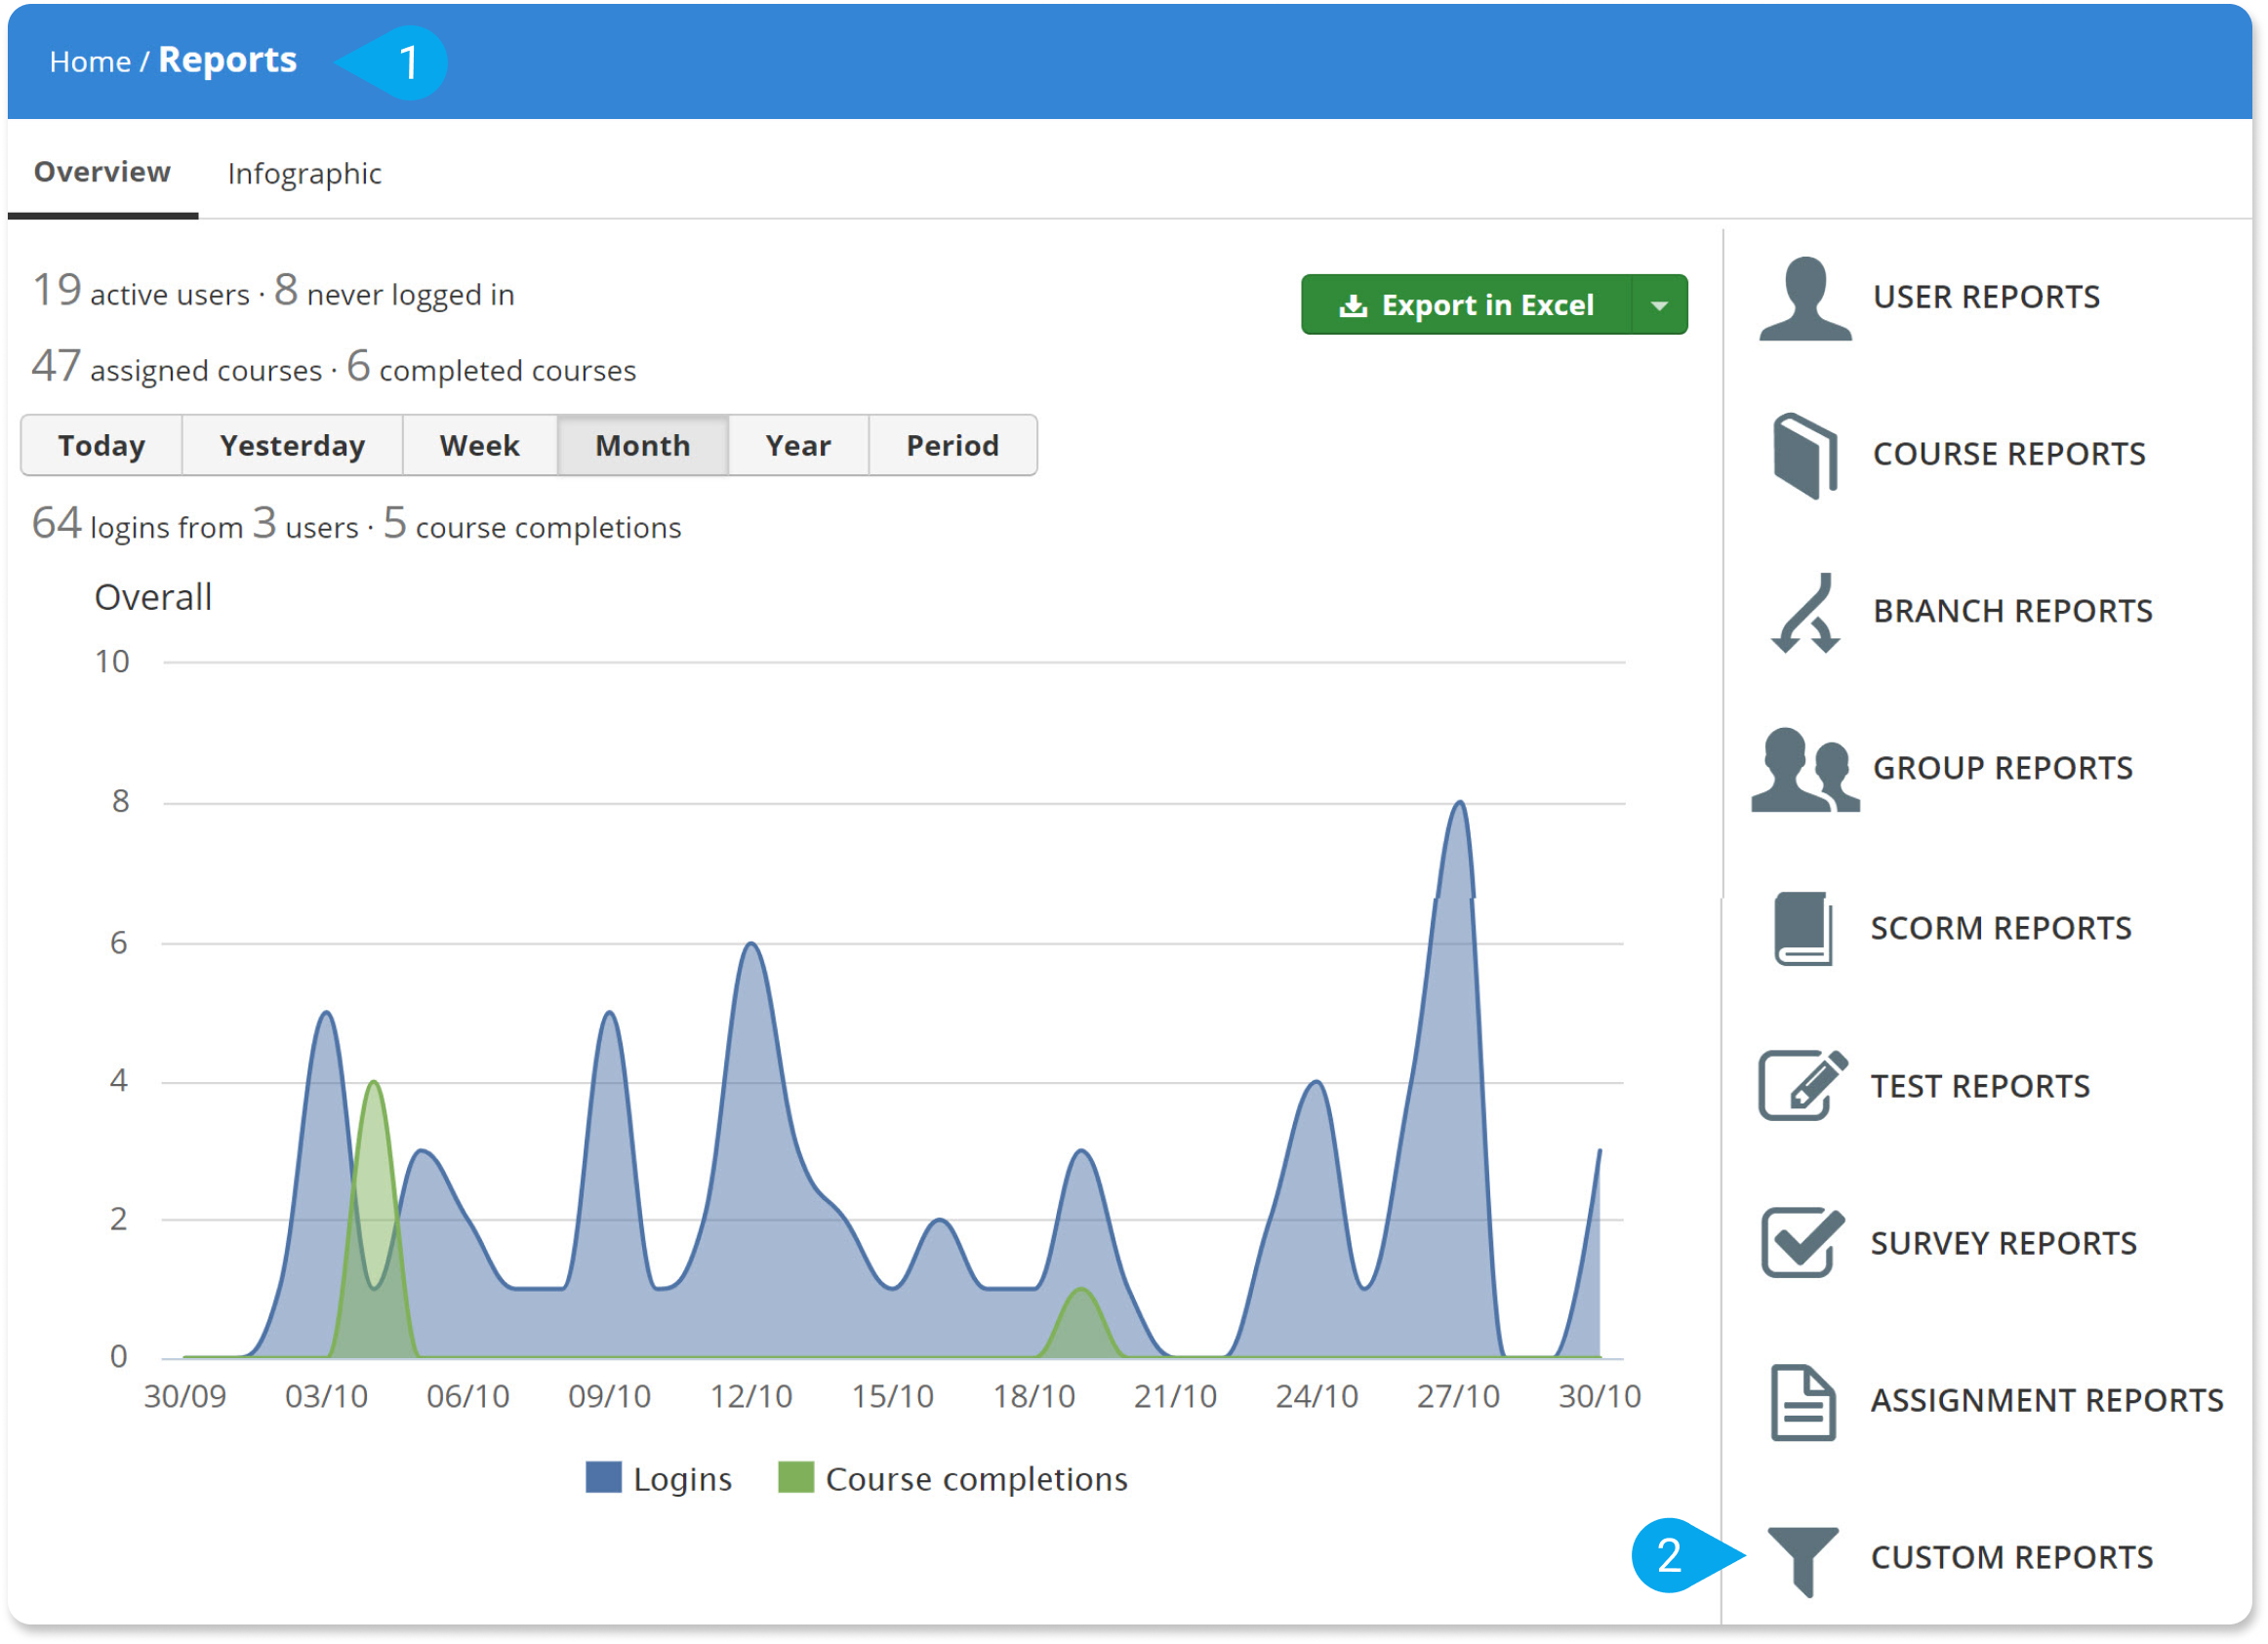
The first screen shows you a general overview of your training program, which includes aggregated statistics on the number of learners and courses, as well as a plot of logins and course completions over some specified date range.

On the right side, there are several individual report sections, each representing a system entity that you can view reports on. Those include Users, Courses, Branches, Groups, SCORM, Tests, Surveys, and Assignments. In other words, all the major aspects of your training program are covered and can be examined in your reports.
After you’ve visited a specific report section you get to see the various statistics collected for it. In the “User Reports” section, for example, TalentLMS will give you statistics on their Logins, Courses, Certifications, and activities (Timeline).
The default reporting period is the current day but you can select your own reporting range by picking among any of the predefined ranges (“Yesterday”, “Week”, “Month”, “Year”) or by explicitly setting the desired start and end date.
Reports are presented in the familiar tabular view, with the primary dimension being your selected section (e.g. User for the User Reports sections), and the remaining columns varying depending on.
Note that the columns can be cross-linked too — when you’re checking out a user’s certifications, for example, you can click on a certificate name to see its contents, date of issuance and other details.
You can also drill-in to get more information for any specific item, e.g. in the report of the user’s certifications you can click on a certificate to see its contents, date of issuance and so on.
Similarly, clicking on a test will give you the list of users that took it and so on. This interconnectedness is a good way to further check something that stands out on a report while still being a couple of browser back-button clicks back to the report you’re investigating.
Of course, not all reports fit on a single screen, nor it always makes sense to view the complete result set. That’s why besides paging and export, TalentLMS gives you numerous filtering options for the Users, Courses, and Tests related reports, allowing you to narrow down their listings to just the items you are interested in.
Alternatively, you can export the report (with filters applied and all) as CSV and load it in Excel or any other compatible tool for further analytics and processing.
The basic reporting tools in TalentLMS let you measure both your employees’ performance and your course’s effectiveness independently, by tracking learning activity-related data and presenting them to you in easy to digest breakdowns and visualizations. This gives you the ability to focus on the big picture or drill-in to get all the details.
And now, with the basics covered, let’s go through some of the more advanced Report-related features on offer in TalentLMS:
Scheduled Reports
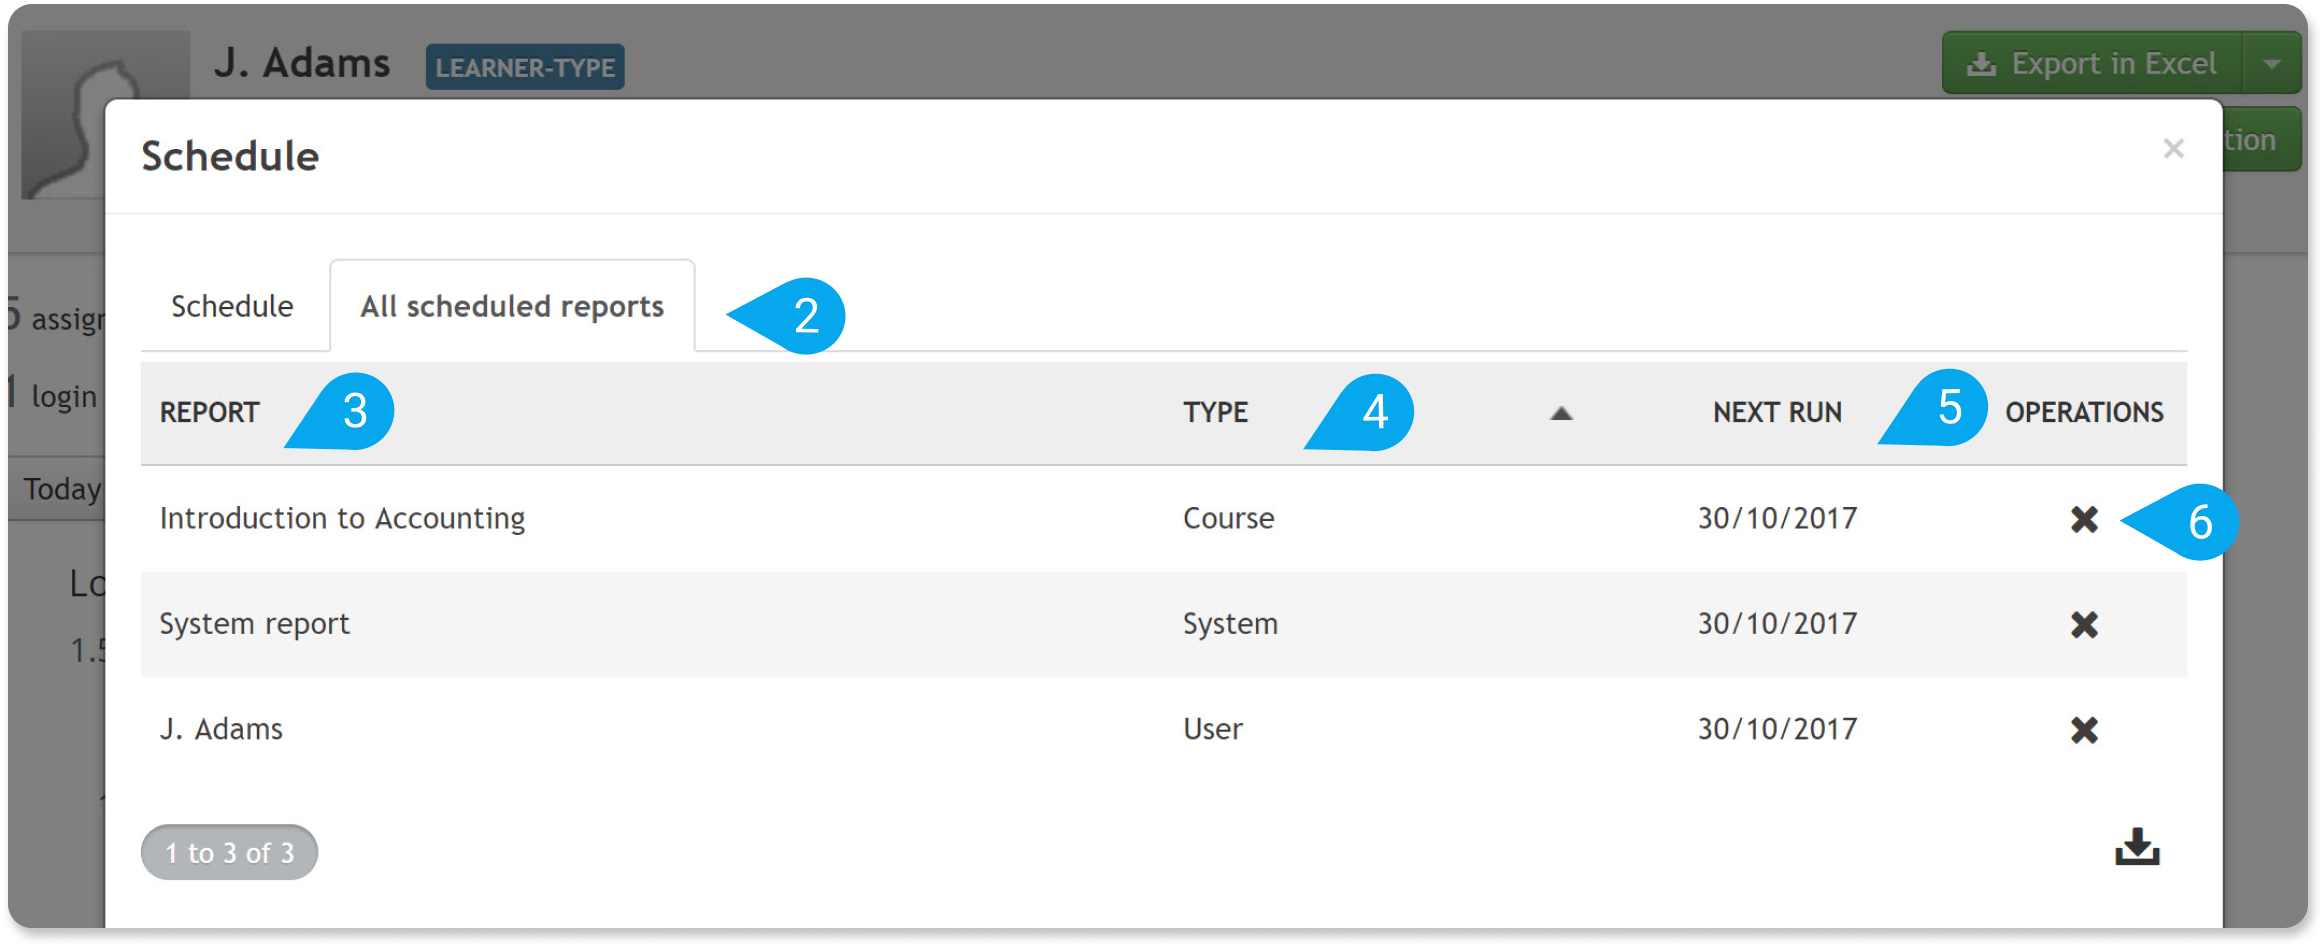
What’s better than going through Reports? Having them come directly to your mailbox whenever you want them, of course, and TalentLMS Scheduled Reports feature lets you do just that.
You can schedule reports to be generated based on your criteria, and have them sent to any set of recipients you want at various intervals. A handy way to staying ahead of your training program, and for keeping your boss and upper management in the loop.

Infographics
Slightly different from the regular reports, in that, they are not in the standard tabular format, Infographic reports allow you to create a stylish, well, infographic, that summarizes key metrics of your training program.
Infographics, in case you have been living under a rock, are fancy mixes of statistics and graphics, that provide an easy-to-grasp statistical overview of a given subject.
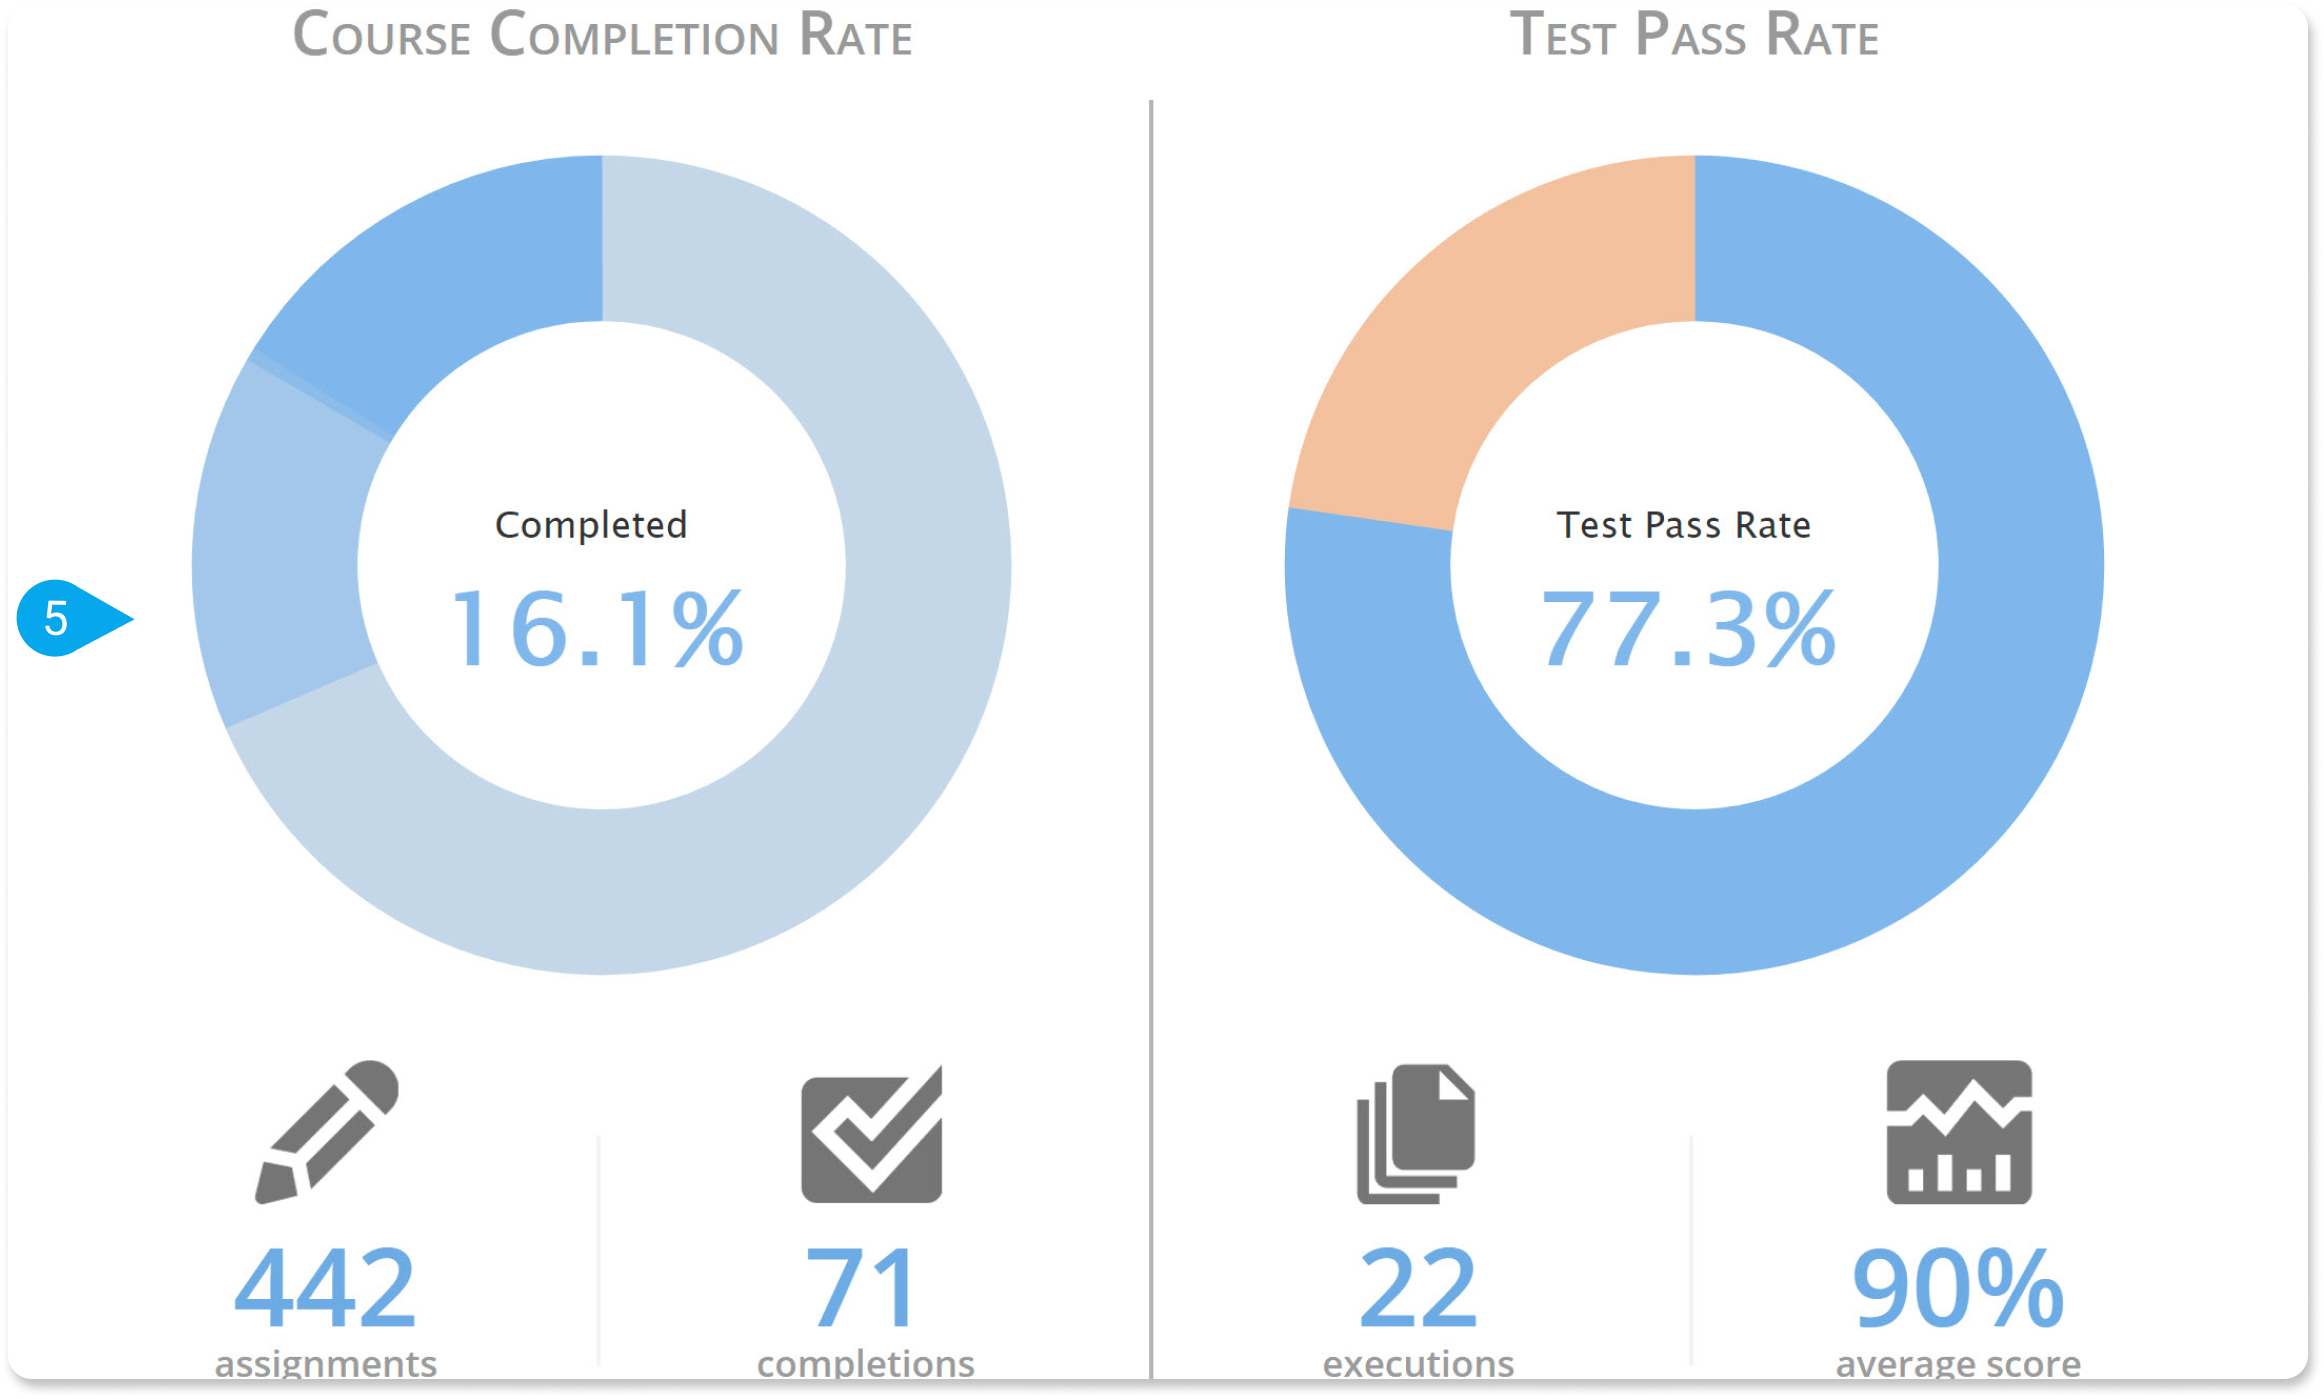
The more general Infographic report in TalentLMS shows generic information on your portal usage, including total training time, a graph of the most active courses, course completion and test pass rates, gamification stats, and more, while another built-in infographic option focused on User related statistics.

Custom Reports
Finally, when the built-in reporting capabilities don’t cut it, TalentLMS lets you create Custom Reports by selecting the entities and activities that you wish to track.
Custom Reports, available on Plus and Basic Unlimited plans and above, give you full control on the users that you monitor and let you create a single report based on Users from multiple courses, groups, and branches in a straightforward manner.
You can for example select to see statistics on users that belong to Branch A and Branch B but who aren’t members of Group C. There are dozens of such filters which can check for Branch and Group membership or not, Course enrollment, and other such aspects.
Custom reports are not just for investigating things or getting an overview of your training program. You can use the lists of system entities you get from a custom report to perform mass actions on it.
For example, you could create a report to get the list of users that have passed a particular set of courses and mass-assign another course to them (thus saving you the trouble of going through each individual user).
Last, but not least, Custom Reports also support for being scheduled — again, just like regular reports.
The LMS Reporting Tools You Need
And this concludes our brief(-ish) report on LMS reporting.
We examined their dual importance (for gauging the effectiveness of your courses and the performance of your learners) and had a look at the LMS reporting tools TalentLMS makes available — including its ability to create Custom Reports. Check out the rest of TalentLMS’s features and create great learning experiences today.
| Tags: LMS Reports
